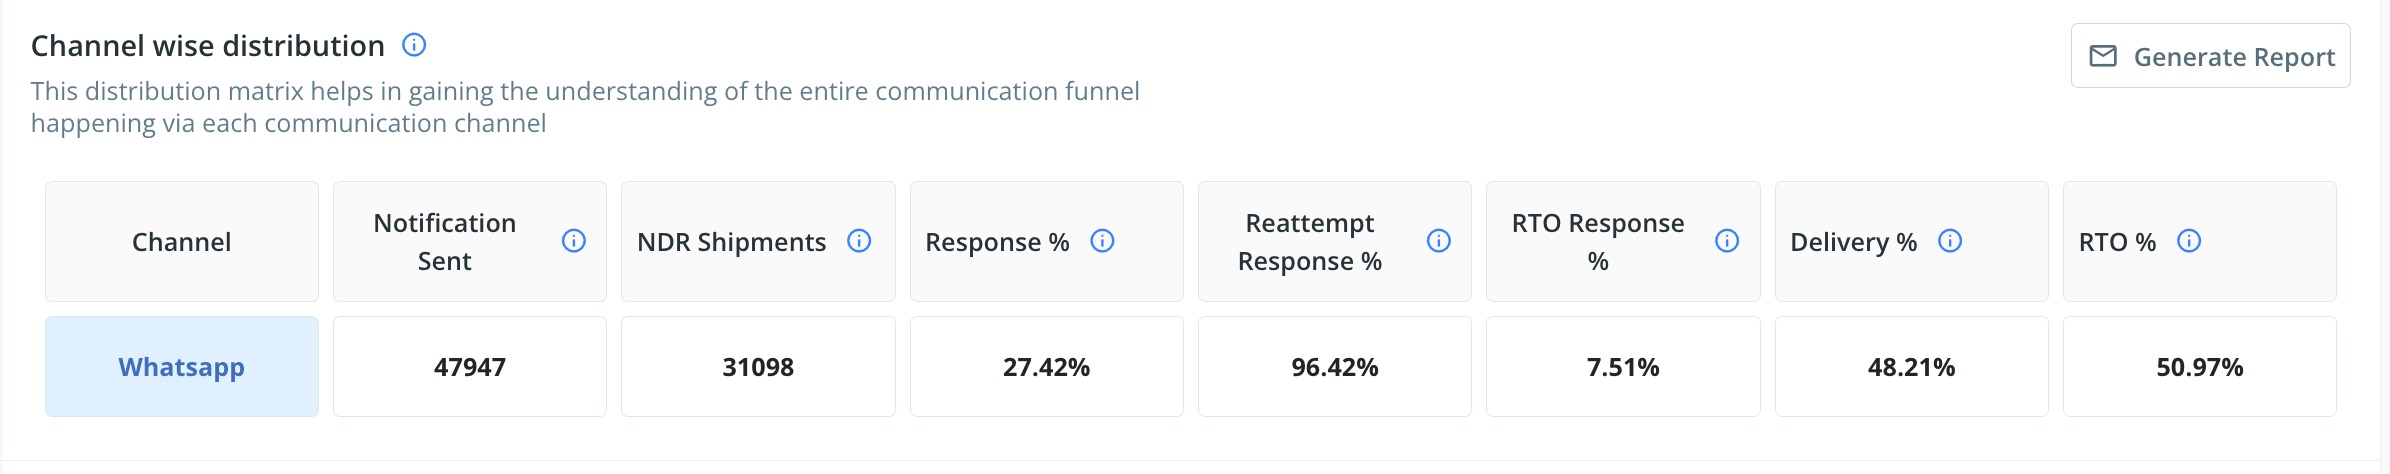
Channel-wise distribution: This distribution matrix offers a comprehensive view of the entire communication funnel across each channel, providing valuable insights into customer engagement and interaction patterns. By examining each communication step, enterprises can identify the effectiveness of each channel, optimize messaging strategies, and better tailor their approach to enhance customer response and satisfaction.
- Notification Sent: The number of notifications that has been sent to the end customers.
- NDR Shipments: The shipments which were marked as Failed Delivery.
- Response %: This section shows the percentage of responses received for NDR shipments/failed shipments.
- Reattempt Response %: This metric indicates the percentage of reattempt responses received from end customers, based on the overall response received.
- RTO Response %: This metric reflects the percentage of reattempt responses received from end customers in relation to the total responses collected.
- Delivery %: This metric shows the percentage of NDR shipments successfully delivered out of the total NDR shipments.
- RTO %: This section shows the percentage of shipments marked as RTO from the total NDR shipments.
Providing the brief of the NDR count-wise distribution section for better understanding.
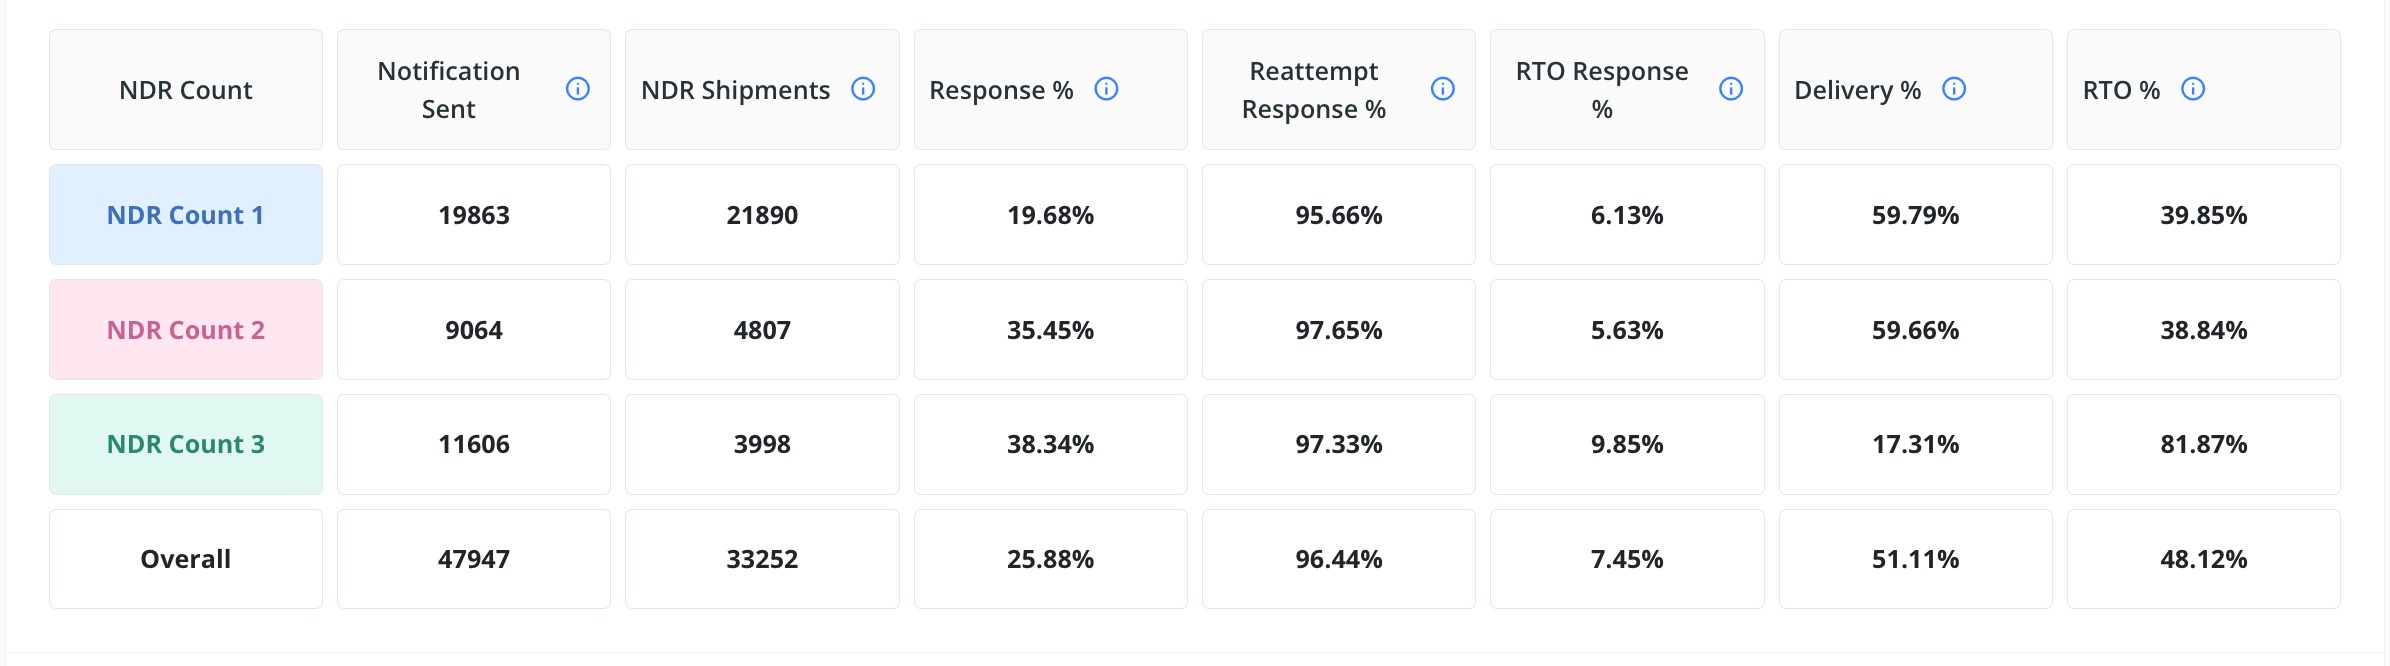
NDR count-wise distribution - This distribution metric provides enterprises with a clear view of the conversion funnel for each failed delivery attempt per shipment. It offers valuable insights into how each delivery attempt progresses and where potential issues may arise, allowing for more targeted strategies to improve delivery success rates.
- NDR Count 1, NDR Count 2, and NDR Count 3: These metrics provide visibility into shipments that fall under NDR statuses 1, 2, and 3. There is also a field named "Overall" that includes all the NDR counts, including 1,2,3 and so on, which is why the total count under "Overall" is higher than the sum of NDR counts 1, 2, and 3.
- Response %: This section shows the percentage of responses received for NDR shipments.
- Reattempt Response %: This metric indicates the percentage of reattempt responses received from end customers, based on the overall response received.
- RTO Response %: This reflects the percentage of RTO responses received from customers relative to the total responses.
- Delivery %: This provides the percentage of NDR shipments that have been delivered out of the total NDR shipments.
- RTO %: This section displays the percentage of shipments that have been marked as RTO out of the total NDR shipments.
The Channel Distribution section provides insight into the communications triggered to the end customer. Meanwhile, the NDR Channel Distribution offers visibility into all failed delivery shipments, regardless of whether notifications were triggered for those shipments or not.
Was this article helpful?
That’s Great!
Thank you for your feedback
Sorry! We couldn't be helpful
Thank you for your feedback
Feedback sent
We appreciate your effort and will try to fix the article